| Formulas |
| I would describe a Chessmetrics rating as "a weighted and padded simultaneous performance rating". That may sound complicated, but I think it's pretty easy to understand if you break it down step-by-step. Let's go through it slowly. |
| First of all, what is a "performance rating"? Performance ratings are most commonly used to measure a player's performance in a particular chess tournament. The idea is to estimate how strong a player is, based only on the evidence of their results during that one event. For instance, let's say you score 3 out of 5 in a six-player tournament where your five opponents are rated 2400 (on average). Even for such a simple example, there are several ways to calculate performance rating. Sometimes you're allowed to average the opponents' ratings together, and sometimes you have to treat them one-at-a-time. For me, I like to keep things as straightforward as possible, so I use the simple linear expectancy model that I myself developed, where each 10% increase in percentage score corresponds to an 85 point advantage in rating. The actual formula is: |
| Performance Rating = Average Opponents' Rating + [(PctScore - 0.50) * 850] |
| So in this case, your 60% score (3/5) means you were 85 rating points better than your opponents, and so your performance rating would be 2400+85 = 2485. However, that is a performance rating for a single event. And at the moment we're talking about how to calculate someone's overall rating. |
| So, an overall rating system based upon performance ratings would take a larger set of your games, not just from one tournament, but all of your available games over a particular span. The Professional Ratings system, based upon a formula invented a decade ago by Ken Thompson, uses your last 100 games. For my Chessmetrics ratings, I use a particular span of time, rather than a particular number of games. |
| Before I go any further, I need to stop and define the next word I used in my definition: "weighted". It wouldn't work too well to just take an average of your past 100 games, because there would be too much emphasis placed on the games from way back when, and not as much on your more recent results. So Ken Thompson's formula weighs the games linearly; your last game gets a 100% weighting, the one from 50 games ago gets a 50% weighting, the one from 90 games ago gets a 10% weighting, and so on. Thus the Professional Ratings are easy to classify as a "weighted performance rating". |
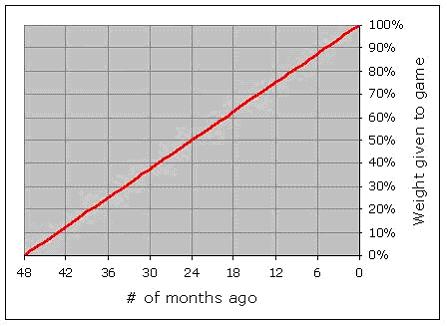
| Enough about the Professional Ratings; let's talk about Chessmetrics. The Chessmetrics ratings also use a "weighted performance rating", but it is based upon how many months ago the games were played, going back four years. So a game you played last month would get a 100% weighting, a game you played 24 months ago would get a 50% weighting, a game you played 47 months ago would get a 2% weighting, and so on. I did a lot of analysis on this, using various weighting curves, and various durations. In each case, I actually used the resultant ratings to try and predict the future, to see how well those ratings would have worked at predicting players' upcoming results. Since we have all that data from the past, why not use it to "train" the best rating formula possible? Out of all the options I tried, the best-performing scheme was a very simple one: weighting the months linearly, and using a 48-month span. |
 |
| However, the choice to use performance ratings as your real rating scheme, brings up an interesting question: what if a player didn't play very many games over that time period? Or what if they played a lot of games? One very interesting limitation to the traditional performance rating calculation is that it doesn't matter! You get just as much credit for scoring +1 in two games, as you would for scoring +12 in twenty-four games. You can see how ridiculous this is by looking at tournament crosstables (the ones that show you players' current performance ratings) for players early in a tournament; you will routinely see performance ratings in the 2800's or even 2900's, by players who aren't nearly that strong but who have managed a very high percentage score in their first few games. It's a basic, fundamental flaw in performance ratings, and I haven't ever seen anyone try to fix it! |
| This was not a problem for the Professional Ratings, which always use the same large number of games, but for me it was problematic, especially because I was trying to rate players from long ago, where there wasn't always a lot of game data available. I also kept it in the back of my mind that it would be great if we could improve the performance ratings formula for individual events, too. Traditional performance rating calculations encounter a divide-by-zero error if you have a 100% score. That's a real shame, because one of the big questions about chess history is what the greatest performances of all time were, and obviously three of the top candidates are Bobby Fischer's 6/6 score in his 1971 match against Mark Taimanov, and Bobby Fischer's 6/6 score in his 1971 match against Bent Larsen, and Bobby Fischer's 11/11 score at the 1963-4 U.S. Championships. |
| BONUS: Since you are being so patient and reading through all of this, I'll save you the need to peek ahead. I did solve this problem, with a better performance rating calculation that you can do in your head (if you're good at division). It really works well. And the answer is that Fischer's U.S. Championship performance (against opponents who on average were rated below 2600) was the 48th best of all time, and his performance against Taimanov (rated around 2730 by today's standards) was the 10th best of all time, and his performance against Larsen (rated around 2750 by today's standards) was the 2nd best of all time, a good 12 points below Anatoly Karpov's performance at Linares 1994. |
| Anyway, I wanted to reward the players who played more games, and I also wanted to reward the players who faced tougher opposition. I took the same approach again, and experimented with various modifiers to the basic performance rating formula, to see what worked best at predicting future results. I came up with something that not only works well, but I think it also makes a lot of sense too. Here's what it does: |
| We have already seen what a "weighted performance rating" is. What I actually use is a "weighted and padded performance rating". I take your raw performance rating, achieved across a certain number of games against a certain average opponents' strength. Then I "pad" the results by adding four fake draws against that same level of average opponents' strength. So if you had played against 2400-strength opposition, I would pad your results with an extra 2/4 against that same 2400-strength opposition. Then I give you three fake draws against 2300-level opposition, and because the padding tends to pull down your rating, I add 43 points back in at the end. That's it. |
| One way to understand this approach is to think about it in terms of different guesses about how strong a player someone is. We can look at their raw performance rating, and use that as one possible guess. Or we could look at "the company you keep", and guess that you are about as strong as the opponents you face. Or we could give a nod to the bell curve and say that it's more likely that you're normal, and we can just guess a relatively low number like 2300. And for each of those guesses, there is a weighting given. For the performance rating, it's the number of games you actually played. For the strength of your opponents, the weighting is fixed at 4 games. And for the 2300-guess, the weighting is fixed at 3 games. |
| The really neat thing here is that this exact formula works well both for overall rating calculations and predicting the future, but also for single event results. It kind of makes sense if you think about it. I have this formula that estimates your strength, given a certain quantity of games results. Why not restrict that quantity to just the games from one event? That would tell us our best guess at their strength, when using only the evidence of that one event, which after all is what a tournament performance rating is supposed to tell you, remember? |
| There are several different ways to express this same formula, depending on how you are approaching it, but let's keep it as simple as possible. We already calculated the performance rating before, so now we'll use it in the rating formula: |
| Rating = (PerformanceRating * NumGames) + (AvgOppRating * 4) + (2300 * 3) | + 43 |
| (NumGames + 7) |
|
| If you use this with my 4-year-linear-weighted approach, you get the actual Chessmetrics rating. If you just use this for a single event, you get a Chessmetrics Performance Rating. You can use it with the FIDE ratings too and it works just fine. For example, if you look at Garry Kasparov's last tournament in Linares, he scored 8/12 against average opposition of 2733. Using my raw performance rating calculation, that's a raw performance of 2875 (because a 67% score means you get 142 points above your opponents). We combine the 12 games at a 2875-level, with 4 games at a 2733-level, and 3 games at a 2300-level. Averaging those together, and then adding 43 back in, that comes out to 2797, suggesting that if we knew nothing else about Garry Kasparov's history other than his performance at Linares 2005, we would estimate that his true strength is 2797. Not as incredible as all those 2850+ performances we see in crosstables, but probably a more reasonable estimate, considering the small number of games (statistically speaking). |
| Before I go any further I just want to emphasize a very important point here. This system rewards players who play a lot of games. That's because there are always 7 "fake" games that provide the padding. If you play a lot of games, the 7 games don't have much effect on your rating. If you only play a few games, they can play a dominant role in your rating, as they should! Now think about that four-year time window. Your games are weighted linearly, so maybe a particular game gets a 36% weighting one month, but the next month it is slightly farther back in the past, so it only gets a 34% weighting. This means that as you go further forward in time without playing any additional games, your weighted number of games will get smaller and smaller. And so the padded games, which are typically a much lower performance rating (because of those three 2300-level games), play an increasingly larger role, and the net effect is that your overall rating will slowly go down, at a steady rate. |
| The reason I call attention to this is that it is an extremely important difference between my Chessmetrics ratings and both the FIDE and Professional schemes. In both of those, if you don't play any games, your rating doesn't change. It could be argued that there is an incentive for top players NOT to play, because they would be risking their high rating which after all is used to guide tournament invitations and even world championship seeding. If we were instead using a scheme like mine which penalizes inactivity and rewards activity, I think we would see the top players playing more frequently, which everyone (except their opponents!) would be happy about. |
| One other point, as long as we're envisioning a better world where the Chessmetrics rating system is used universally, is that it would be easy to fine-tune the rating system to be more dynamic or less dynamic. I picked 4 years for my time window, because that's what worked best at predicting future results, but there could be a very strong argument for a shorter duration, such as 2 years. The ratings wouldn't work quite as well at predicting future results, but that's not the point; they would be viewed as more of an indication of "recent accomplishment" rather than "estimated strength". And it may be that you would want the rating to be a reward for accomplishment rather than a more scientific statistical estimate of strength. |
| Okay, so that explains what I mean by a "weighted and padded performance rating" It's "weighted" because I place more importance on recently-played games. And it's padded because the actual results are averaged in with a small (but constant) number of "fake" lower-performance results. And hopefully by now you also understand my new invention, a formula that can be used to estimate performance ratings, which rewards players who play lots of games, and players who play difficult opposition, and it DOESN'T fall apart with a 100% score. If you've had enough, you could stop right there, but if you're still with me, take a deep breath and we can now talk about what I mean by a "weighted and padded simultaneous performance rating", which is what I actually said up at the top. |
| There is an interesting question that most people probably never think about when they look at chess ratings, but you inevitably run into it as soon as you try to calculate your own system of ratings. The question is, where do ratings come from in the first place? You probably know how Elo ratings work, how you gain or lose points from your rating based on how you do against other players, but where did your rating come from in the first place? Okay, it came from playing against other players with ratings, and thus you got a provisional rating (based on your performance rating), but where did their ratings come from? If you trace it all the way back, you'll find that it all started from a "simultaneous performance rating calculation". That's where Elo's FIDE ratings originally came from, and that's where Thompson's Professional ratings originally came from. Here is how they work: |
| If you have a closed pool of players, who are all ultimately connected to each other by some network path like "A played B, and B played C, and C played D, so A and D are connected", you can calculate a performance rating for each player, using just the games against other players in the pool. Then you can plug those performance ratings in as updated ratings for everyone, and do the same calculation again. If you do this long enough, it will converge on a single solution, and it doesn't really matter what the initial ratings were. You could have used 2500 for everyone, for instance, or even just a random number. It would still converge just fine. The only special thing to worry about is that the rating list has to be calibrated after each iteration. What I mean by that is that you have to establish some kind of baseline statement like "the average rating will be 2500" or "the #10 rating will be 2600" or something like that. Otherwise the ratings might not converge onto a value; they might just slowly creep up or creep down without ever stopping. |
| So, let's take that Linares 2005 tournament again as an example. The average FIDE rating of the participants was 2743, and so we'll use that to calibrate the ratings after every step: the average rating will always be 2743. Just to demonstrate that they will converge no matter what you pick, I'll start with some silly initial ratings: |
| Player |
Initial Rating |
| Adams |
2443 |
| Anand |
2543 |
| Kasimdzhanov |
2643 |
| Kasparov |
2743 |
| Leko |
2843 |
| Topalov |
2943 |
| Vallejo Pons |
3043 |
|
| Using those initial ratings as the "strength of opponent" in each game, we can calculate each person's average opponent rating across all of their own games, and combining this with each player's percentage score, we can get a raw performance rating for each person: |
| Player |
Initial
Rating |
Average
Opponent
Rating |
Pct
Score |
Raw
Performance
Rating |
| Adams |
2443 |
2793 |
46% |
2758 |
| Anand |
2543 |
2776 |
54% |
2812 |
| Kasimdzhanov |
2643 |
2760 |
33% |
2618 |
| Kasparov |
2743 |
2743 |
67% |
2885 |
| Leko |
2843 |
2726 |
50% |
2726 |
| Topalov |
2943 |
2710 |
67% |
2851 |
| Vallejo Pons |
3043 |
2693 |
33% |
2551 |
|
| And then once you've done that, you can take each person's raw performance rating, and plug it back in on top of their initial rating. That has the effect of changing everyone's average opponent rating, and so everyone gets a new raw performance rating. So you take that new raw performance rating and plug it in as their rating for the next iteration, and so on. If you do this a few times, it eventually converges, as you can see here: |
| Player |
Initial
Rating |
After
Iteration
#1 |
After
Iteration
#2 |
After
Iteration
#3 |
After
Iteration
#4 |
After
Iteration
#5 |
After
Iteration
#6 |
After
Iteration
#7 |
After
Iteration
#8 |
| Adams |
2443 |
2758 |
2705 |
2714 |
2712 |
2713 |
2713 |
2713 |
2713 |
| Anand |
2543 |
2812 |
2767 |
2774 |
2773 |
2773 |
2773 |
2773 |
2773 |
| Kasimdzhanov |
2643 |
2618 |
2622 |
2621 |
2622 |
2622 |
2622 |
2622 |
2622 |
| Kasparov |
2743 |
2885 |
2861 |
2865 |
2864 |
2864 |
2864 |
2864 |
2864 |
| Leko |
2843 |
2726 |
2746 |
2743 |
2743 |
2743 |
2743 |
2743 |
2743 |
| Topalov |
2943 |
2851 |
2867 |
2864 |
2864 |
2864 |
2864 |
2864 |
2864 |
| Vallejo Pons |
3043 |
2551 |
2633 |
2620 |
2622 |
2621 |
2622 |
2622 |
2622 |
|
| I could have started with all 2743's, or in the opposite order, and it wouldn't have mattered; they would still converge to the same list of final ratings. That's the important part of this; the system stands on its own without depending on any other prior ratings. So if we wanted to, we could have completely ignored the FIDE ratings, started over with a brand-new rating system, seeded by the Linares players. Then everyone else gets their ratings from playing one of these Linares participants, and then more players have ratings, and so there are more rated opponents, and so on... |
| That is exactly how the original FIDE ratings started, with one of these simultaneous calculations. That is also how I started my original Chessmetrics ratings a few years ago, with a big simultaneous calculation covering the period from 1840 to 1850, to get the initial ratings, and then I went from there, kind of like the Elo ratings but in a different direction. |
| This sort of simultaneous calculation approach always really appealed to me. I love the idea that it doesn't have to care about what ratings came before. In my opinion, that is one weakness of the Elo system. Your rating depends on the ratings of your opponents, from older rating lists, and if there is an overall inflationary trend (or a deflationary trend) in the ratings, then it really matters whether you played those opponents a month ago or a few years ago. Wouldn't it be neat, I thought, if each rating list could stand totally on its own, independent of any prior rating lists and based just on game results? Then all of those inflationary effects could go away. |
| Certainly one challenge there is the lack of continuity. One rating list might be calibrated totally differently from the next rating list. But this could be solved through some sort of approach that aligns one rating list with the one before it. That's just what Elo did in his historical ratings calculation from his book. He did a simultaneous calculation across a five year span (like 1920-1925, for instance) and then one for the next five year span (1925-1930), and then aligned them together (by adding a particular number to every rating on the 1925-1930 list) so that the average ratings of each list were the same. I prefer an approach that doesn't depend so heavily on the size of your set of players. My new Chessmetrics ratings, to jump ahead a little bit, are in fact calculated in this way, each month. Each month's rating list is totally independent of the prior month's list, other than the fact that they both share a very similar set of games, since they each reach back 48 months. In order to align them, I take everyone who is ranked between #3 and #20 on both lists, average them together, and adjust the second month's list up or down by a constant amount (I call this "calibrating") so that the average rating of the two groups (i.e., the players who were ranked between #3 and #20 on both lists) is the same. By excluding the top two players, I'm hoping to avoid bad effects caused by a player who shoots to the top of the list from one month to the other, and the same thing in reverse by ignoring people who plummet out of the top 20 between one month and the next. In this way I am hopefully capturing a group of players whose strength is remaining relatively constant. |
| I always wanted to do the ratings this way, but there was always a serious problem. You want a nice big set of players in your pool, and so you have to set the minimum required number of games to be a fairly low value. This means that players with only a few games can really get skewed results and mess up the calculation for everyone else. |
| Well, the epiphany I finally had, after months of agonizing over this, was to combine the two major approaches I have just gone through. I use a simultaneous calculation that stands apart from any other rating lists, and all ratings are self-consistent because they converge as a group. However, instead of using a raw performance rating during the simultaneous calculation (like I did in the Linares example above) I realized I could use the "padded, weighted performance rating" approach, which has the effect of toning down the effects of the players with only a few games. |
| Thus, the rating scheme I finally settled on, after months and months of research, was indeed a "weighted and padded simultaneous performance rating". All of the historical ratings and performance ratings that were calculated for use in the Chessmetrics site, do in fact use this weighted and padded simultaneous performance rating scheme. |
| If you are still with me in this writeup, by now you should pretty much understand how the Chessmetrics ratings work. One thing I haven't talked about is how I form the closed pool each month. First of all, I select a prominent, active top player as the "seed" for the closed pool. I wanted to pick the world champion so it wasn't arbitrary, but unfortunately the world champions aren't always the most active players (to put it mildly!) so I would typically pick a top-five or top-ten player who had been very active over the previous four years. To give an example, from 1910-1912, I picked Carl Schlechter, then from 1913-1917 I picked Frank Marshall, then from 1918-1926 I picked Akiba Rubinstein, then from 1927-1938 I picked Alexander Alekhine, and so on. |
| Once I had a seed player, I picked their five most common opponents (based upon a weighted number of games, over the previous four years) to add to the pool. That would typically bring the pool up to six players. Then out of that common set of six players, I would pick the four players with the most total games against the common pool, to bring the list up to ten players. Then I would add five more, and five more again, to get to a total of twenty. Then I would run it eight more times, adding in everyone with a certain minimum number of games (it varied over time) at each step. Then I would stop, because even though you could keep adding in more and more players at every step (as there are more and more connections), the link between your seed player and these new players gets more and more tenuous. So I drew the line at eleven degrees of separation, which is probably too many in modern times but it was necessary in the older days, where there was not the same level of travel and mingling of players like we get now. Also, as a general rule I only apply my formula to players with 5+ total weighted games. Otherwise those padded games just play too much of a role. The same thing applies to performance ratings; I only consider performances involving 5 or more games. |
| I don't think there's too much more to say about how my ratings work. One other thing that comes to mind is that this formula is designed to work with the top players, say those with a FIDE rating above 2300. The problem is the padding games against 2300-level opposition. For top players, that padding will have the effect of pulling their rating downward, as desired, but for weaker players it will actually pull their rating upwards. The peak of the bell curve is surely below 2300, so we don't want to pull players in the wrong direction. So if we ever wanted to implement this scheme on a wider basis, that 2300-value would need to be adjustable somewhat. Perhaps the well-known concept of a rating floor could be applied. As you get better and better, your "padding floor" goes from 1700 to 2000 to 2300, where it resides forevermore. I haven't worked on that problem too much but it seems like a moveable floor value would solve the problem very well. |
| I would also like to explain the term "class" which I use to describe the strength of a tournament. The traditional measure used to indicate the strength of a tournament is its "category", a simple integer used to roughly identify the average rating of the participants. Each 25 points of average rating increases the category by one point. This can be a useful indicator of how elite a tournament might be, but as an overall indicator of tournament strength, I think it's definitely flawed. Even with my historical ratings, avoiding the inflation that you see in today's FIDE ratings, virtually all of the top-category tournaments turn out to be very recent ones. As an example, if you were to rank all tournaments in chess history based upon the average Chessmetrics rating of the participants, and took the top fifteen on the list, here's what you would see: |
| |
Tournament |
Year |
Average Rating |
Category |
Top Ten Participation |
| #1 |
Las Palmas |
1996 |
2797 |
22 |
#1 #2 #3 #4 #5 #7 |
| #2 |
Linares |
1998 |
2785 |
22 |
#1 #2 #3 #4 #6 #7 #10 |
| #3 |
Linares |
2000 |
2778 |
22 |
#1 #2 #3 #4 #5 |
| #4 |
St. Petersburg |
1895 |
2777 |
22 |
#1 #3 #4 #5 |
| #5 |
Dortmund |
2001 |
2772 |
21 |
#2 #3 #4 #5 #7 |
| #6 |
Linares |
1999 |
2770 |
21 |
#1 #2 #3 #4 #6 #7 #8 |
| #7 |
Amsterdam (Optiebeurs) |
1988 |
2768 |
21 |
#1 #2 #4 |
| #8 |
Novgorod |
1994 |
2765 |
21 |
#1 #4 #6 #8 #10 |
| #9 |
Amsterdam (Euwe Memorial) |
1994 |
2763 |
21 |
#1 #4 #10 |
| #10 |
Novgorod |
1997 |
2762 |
21 |
#1 #3 #6 #9 #10 |
| #11 |
Reggio Emilia |
1991 |
2759 |
21 |
#1 #2 #3 #4 #5 #7 #9 |
| #12 |
Amsterdam (Euwe Memorial) |
1988 |
2753 |
21 |
#2 #3 #8 |
| #13 |
Linares |
2002 |
2750 |
20 |
#1 #3 #5 #8 #10 |
| #14 |
Dos Hermanas |
1996 |
2750 |
20 |
#1 #3 #4 #5 #6 #7 #8 |
| #15 |
Astana |
2001 |
2749 |
20 |
#1 #3 #5 #8 #10 |
|
| So that means out of the top fiteen, fourteen of them were played within the past twenty years, with St. Petersburg 1895 being the only exception. If you then look at #16 through #30, again there are fourteen out of fifteen from the past twenty years, with only one exception (The Hague/Moscow 1948). If you asked a bunch of chess historians to decide what the thirty strongest chess tournaments in history were, I really don't think you would hear 28 tournaments named from the past twenty years. It's been a great era for supertournaments, but not that great... |
| This topic first came up for me in 2000 when I was asked by KasparovChess.com to write a statistical article analyzing the tournament accomplishments of Garry Kasparov over the previous two years. Kasparov's original idea was that you could evaluate the strength of a tournament by looking at the participation of the top ten players from the rating list. This was originally motivated by the fact that historical ratings were unavailable for the pre-1970 era, but even now that I have those ratings, I still prefer the idea of looking to the top ten rather than average rating. Using the category is just too unfair to the large round-robin tournaments that had virtually everyone from the top ten playing. Those tournaments are not suddenly easier to win just because you've added in a bunch of lower-rated players; in fact I've shown in the past that they are even harder to win. Also there are so many players rated pretty near the top these days, that it is much simpler to assemble a high-average tournament field even without getting unusually good turnout from the top ten. |
| As part of that article for KasparovChess.com, I developed a formula which I am now calling the tournament "class". You look at the top ten on the rating list, at the time the tournament started, and see who is participating in the tournament. Having the #1 player earns the tournament 4 points, and having the #2 tournament earns it another 4 points. For #3 and #4, it's only 3 points per player. For #5 and #6, it's 2 points, and for #7, #8, #9, and #10, it's 1 point each. So if you just had the #1, #3, and #9 players in your tournament, the tournament would be a class 8 (that's 4+3+1). If a tournament had all ten from the top list (and possibly more) then it would get the theoretical maximum class of 22 (that's 4 + 4 + 3 + 3 + 2 + 2 + 1 + 1 + 1). This has actually never happened in chess history. Players ranked out of the top ten don't affect the "class". They don't help it, and they don't hurt it. I picked this formula to correspond roughly with the scale of the better-known "category". If you look at the top-fifteen tournaments from chess history, rated by my new formula, I think it's much closer to what is generally meant by a "strong" tournament (historically speaking). |
| |
Tournament |
Year |
Average Rating |
Category |
Top Ten Participation |
Class |
| #1 |
Vienna |
1882 |
2622 |
15 |
#1 #2 #3 #4 #5 #6 #7 #8 #10 |
21 |
| #2 |
Linares |
1993 |
2747 |
20 |
#1 #2 #3 #4 #5 #6 #7 #8 #10 |
21 |
| #3 |
Nottingham |
1936 |
2644 |
16 |
#1 #2 #3 #4 #5 #6 #7 #8 |
20 |
| #4 |
AVRO |
1938 |
2736 |
20 |
#1 #2 #3 #4 #5 #6 #7 #8 |
20 |
| #5 |
Linares |
1992 |
2737 |
20 |
#1 #2 #3 #4 #5 #6 #7 #8 |
20 |
| #6 |
Wijk aan Zee (Corus) |
2001 |
2730 |
20 |
#1 #2 #3 #4 #5 #6 #7 #8 |
20 |
| #7 |
London |
1883 |
2649 |
16 |
#1 #2 #3 #4 #5 #6 #7 |
19 |
| #8 |
Hastings |
1895 |
2664 |
17 |
#1 #2 #3 #4 #6 #7 #8 #9 |
19 |
| #9 |
Linares |
1994 |
2734 |
20 |
#1 #2 #3 #4 #5 #7 #8 #9 |
19 |
| #10 |
Wijk aan Zee (Hoogovens) |
1999 |
2714 |
19 |
#1 #2 #3 #4 #5 #6 #7 |
19 |
| #11 |
Baden-Baden |
1870 |
2628 |
16 |
#1 #2 #3 #5 #6 #7 #8 #9 |
18 |
| #12 |
San Sebastian |
1911 |
2693 |
18 |
#2 #3 #4 #5 #6 #7 #8 #9 #10
|
18 |
| #13 |
St. Petersburg |
1914 |
2725 |
19 |
#1 #2 #3 #4 #5 #6 |
18 |
| #14 |
Karlsbad |
1929 |
2646 |
16 |
#2 #3 #4 #5 #6 #7 #8 #9 #10 |
18 |
| #15 |
Zurich (Candidates) |
1953 |
2722 |
19 |
#1 #3 #4 #5 #6 #7 #8 #9 #10
(plus #11 #12 #13 #14 and #16!) |
18 |
|
| Just to point out the balance of that list, there are five tournaments from the past fifty years, six tournaments from the fifty years before that, and four tournaments from the fifty years before that. So anyway, I don't use "category" in my lists on this site; I use "class". And hopefully now you understand what it means. I also rank the strongest matches (not tournaments) between two players, and there too I use the players' world ranks. I rank all of the matches, based upon the world ranking of the "weaker" player. So a match between #5 and #7 would show up as "stronger" than a match between #1 and #9, for instance. I tried various approaches and this was the one I liked best. Note that in all of chess history there have only been fourteen times where #1 played a match against #2, and more than half of those matches (eight) involved Anatoly Karpov! |
| I can't think of any other formulas that I am using on this site. There are certainly many other analytical techniques I've developed over the years: ways to evaluate the "effectiveness" of various world championship cycles, calculating the percentage chance for someone to win a tournament, measuring whether certain players do particularly well or particularly poorly against other certain players, stuff about chess-playing computers and computer programs, fine-tuning we could do to the Elo system of ratings without major change, comparison between Chessmetrics predictive ability and FIDE predictive ability, various things about player age... wow, that's a disturbingly long list! I would love to explore all of these topics in an integrated way on this website, but we'll see how far I get with that list. There is a lot more to talk about than just the statistical analysis. One extremely important topic in any rating system, whether it be historical or contemporary, is where you get your underlying data, and how you use it. That is the topic of the next section: |
| Read about the source data |